← Back to work

Verana Health · Retina market analytics

A crowded drug market, readable at a glance.

A 0-to-1 analytics product that shows drug makers how retina treatments are used, and how that use is changing.

Three views, one market
Retina market analytics

A crowded drug market,readable at a glance.

9:41
Help & DocumentationCarla Rodriguez
NORTHWIND BIO

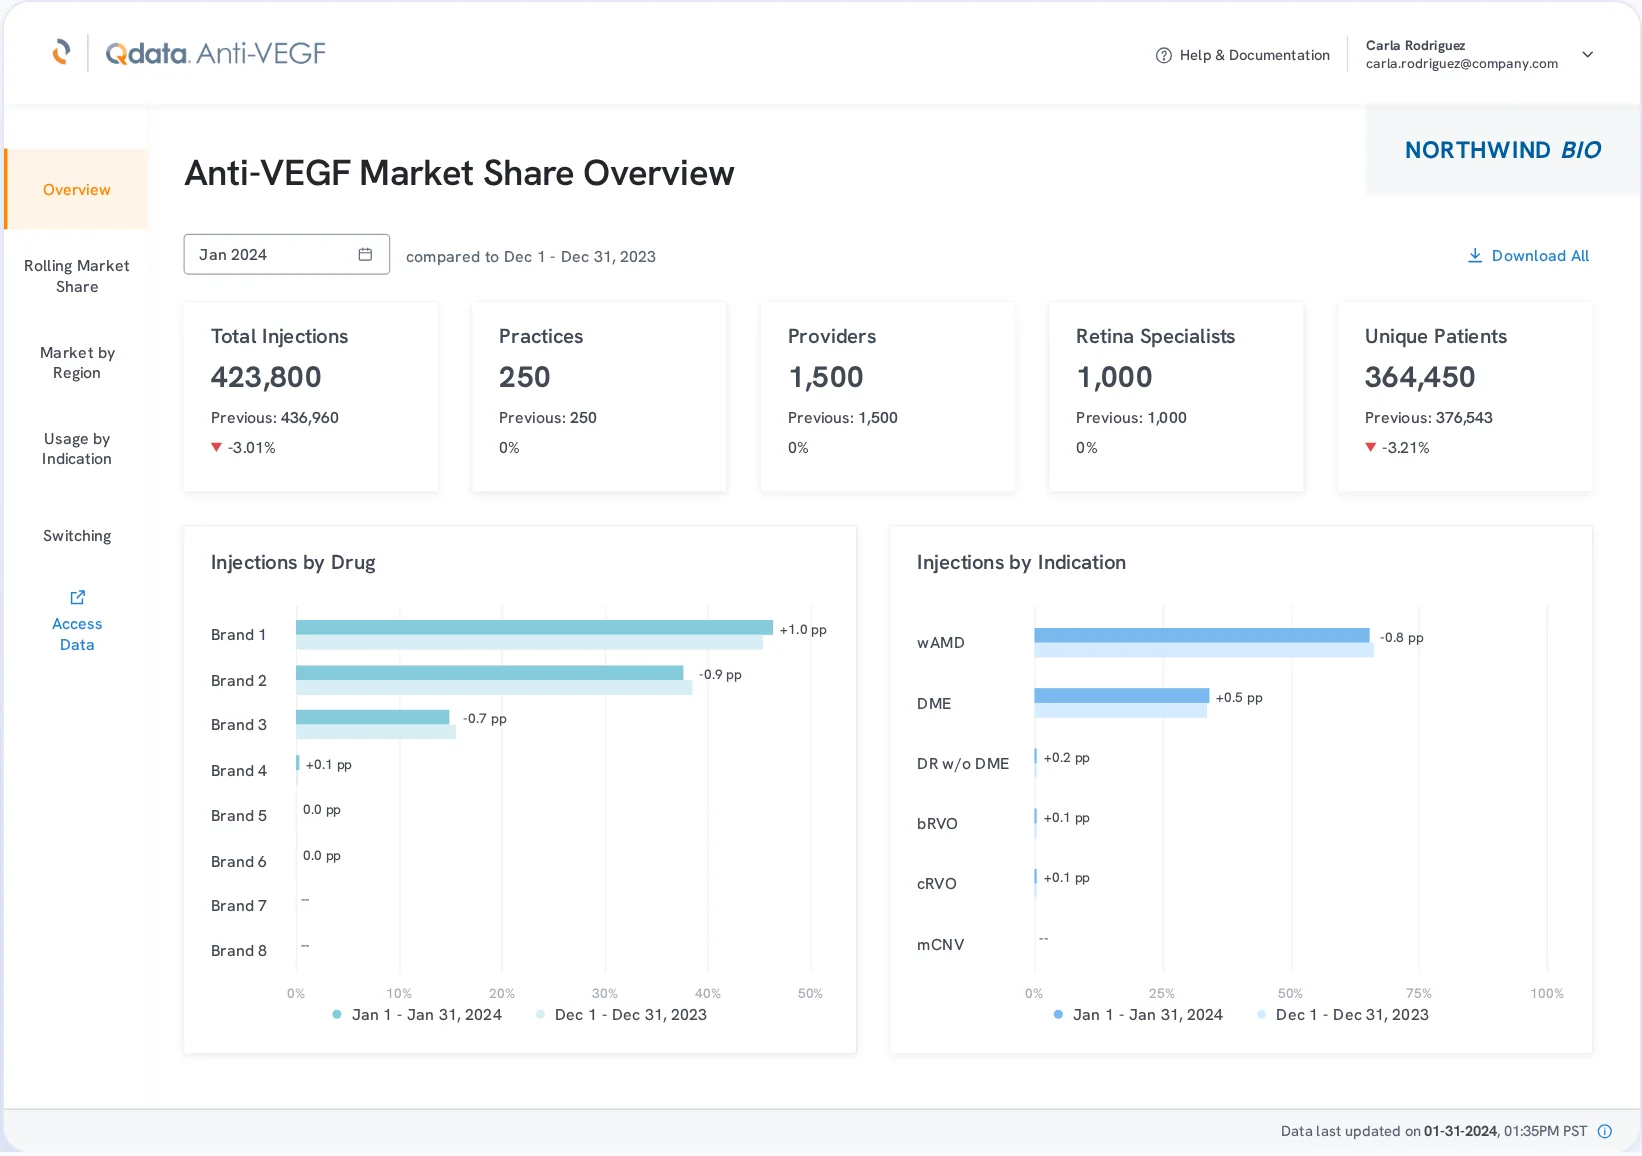
Anti-VEGF Market Share Overview

Jan 2024compared to Dec 1 - Dec 31, 2023Download All
Total Injections-3.01%
423,800
Previous: 436,960
Practices0%
250
Previous: 250
Providers0%
1,500
Previous: 1,500
Retina Specialists0%
1,000
Previous: 1,000
Unique Patients-3.21%
364,450
Previous: 376,543

Injections by Drug

Brand 1
+1.0 pp
Brand 2
-0.9 pp
Brand 3
-0.7 pp
Brand 4
+0.1 pp
Brand 5
0.0 pp
Brand 6
0.0 pp
Jan 2024Dec 2023

Injections by Indication

wAMD
-0.8 pp
DME
+0.5 pp
DR w/o DME
+0.2 pp
bRVO
+0.1 pp
cRVO
+0.1 pp
mCNV
--
Jan 2024Dec 2023
9:41
Help & DocumentationCarla Rodriguez
NORTHWIND BIO

Anti-VEGF Market Share Overview

Jan 2024compared to Dec 1 - Dec 31, 2023Download All
Total Injections-3.01%
423,800
Previous: 436,960
Practices0%
250
Previous: 250
Providers0%
1,500
Previous: 1,500
Retina Specialists0%
1,000
Previous: 1,000
Unique Patients-3.21%
364,450
Previous: 376,543

Injections by Drug

Brand 1
+1.0 pp
Brand 2
-0.9 pp
Brand 3
-0.7 pp
Brand 4
+0.1 pp
Brand 5
0.0 pp
Brand 6
0.0 pp
Jan 2024Dec 2023

Injections by Indication

wAMD
-0.8 pp
DME
+0.5 pp
DR w/o DME
+0.2 pp
bRVO
+0.1 pp
cRVO
+0.1 pp
mCNV
--
Jan 2024Dec 2023
9:41
Help & DocumentationCarla Rodriguez
NORTHWIND BIO

Anti-VEGF Market Share Overview

Jan 2024compared to Dec 1 - Dec 31, 2023Download All
Total Injections-3.01%
423,800
Previous: 436,960
Practices0%
250
Previous: 250
Providers0%
1,500
Previous: 1,500
Retina Specialists0%
1,000
Previous: 1,000
Unique Patients-3.21%
364,450
Previous: 376,543

Injections by Drug

Brand 1
+1.0 pp
Brand 2
-0.9 pp
Brand 3
-0.7 pp
Brand 4
+0.1 pp
Brand 5
0.0 pp
Brand 6
0.0 pp
Jan 2024Dec 2023

Injections by Indication

wAMD
-0.8 pp
DME
+0.5 pp
DR w/o DME
+0.2 pp
bRVO
+0.1 pp
cRVO
+0.1 pp
mCNV
--
Jan 2024Dec 2023

Patient Journey

ContinuingSwitchNew

Rolling Market Share by Total Injections per Drug

Compare time periods
Market Share in %
0%10%20%30%40%50%01/01/202401/08/202401/15/202401/22/202401/29/2024
Brand 1Brand 2Brand 3Brand 4Brand 5Brand 6Dashed: Dec 2023
Week of 01/22/2024
Brand 146.6%
Brand 236.0%
Brand 311.9%
Brand 41.0%
Brand 50.4%
Brand 64.1%
View data for
Brand 1
Brand 1
Brand 2
Brand 3
Brand 4
Brand 5

Patient Journey

ContinuingSwitchNew

Switching From Brand 1

05,00010,00015,00020,000
Brand 2
Brand 3
Brand 4
Brand 5
Brand 6
Brand 7
Brand 8
Jan 1 - Jan 31, 2024Dec 1 - Dec 31, 2023

Switching To Brand 1

010,00020,00030,00040,00050,000
Brand 2
Brand 3
Brand 4
Brand 5
Brand 6
Brand 7
Brand 8
Jan 1 - Jan 31, 2024Dec 1 - Dec 31, 2023

A crowded drug market, readable at a glance.
Market overviewRolling market shareBrand switching

* Screens updated for this portfolio. Names and data are not real.

Brand teams couldn’t query their own market

Several drugs for serious eye disease, all given as injections, compete for the same retina patients. The answer to “how is my drug doing?” lived in real-world clinical data the drug makers’ brand teams couldn’t reach. I designed the product from 0 to 1, from the first screen customers see to the monthly dashboards. Customers were hard to reach before launch, so I iterated with the product manager, data science, subject matter experts and engineers.

Every number carries its comparison

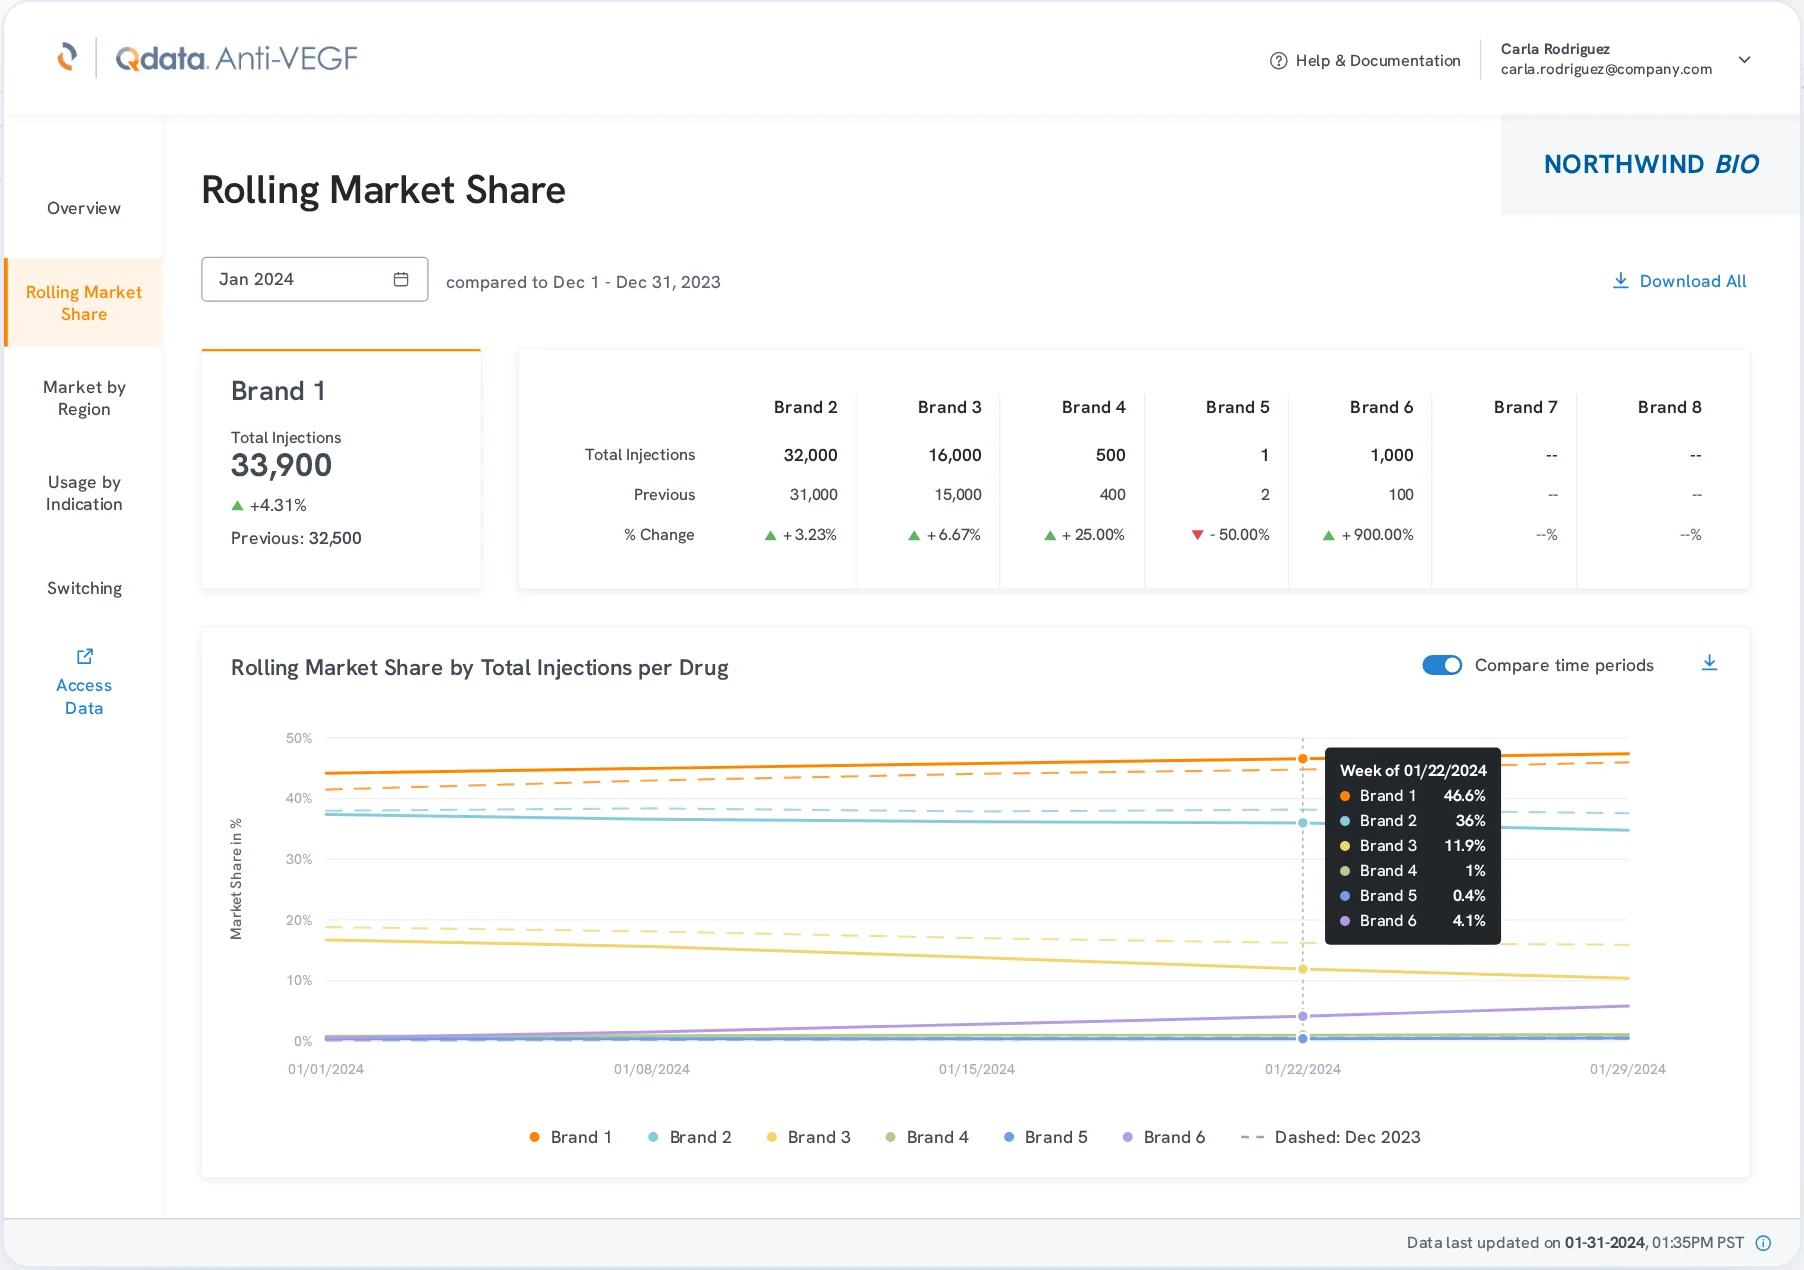
Each total shows its previous value and change, and every line or bar sits beside its prior period. When a comparison would reach back before the data starts, the option is disabled with a note, so no misleading zero is ever drawn.

A number on its own starts an argument. A number next to its comparison starts a decision.

Help & Documentation
Carla Rodriguezcarla.rodriguez@company.com
Overview
Rolling Market
Share
Market by
Region
Usage by
Indication
Switching
Access
Data
NORTHWIND BIO

Rolling Market Share

Dec 2023
compared to Nov 1 - Nov 30, 2023
Download All
Oct 2023
Nov 2023
Dec 2023
Jan 2024
Data last updated on 01-31-2024, 01:35PM PST

Brand 1

Total Injections
0
+4.31%
Previous: 32,500
 Total InjectionsPrevious% Change
Brand 232,00031,000+ 3.23%
Brand 316,00015,000+ 6.67%
Brand 4500400+ 25.00%
Brand 512- 50.00%
Brand 61,000100+ 900.00%
Brand 7------%
Brand 8------%

Rolling Market Share by Total Injections per Drug

Compare time periods
Market Share in %
0%10%20%30%40%50%01/01/202401/08/202401/15/202401/22/202401/29/2024
Brand 1Brand 2Brand 3Brand 4Brand 5Brand 6Dashed: Dec 2023
Week of 01/22/2024
Brand 146.6%
Brand 236.0%
Brand 311.9%
Brand 41.0%
Brand 50.4%
Brand 64.1%
Rolling market share. Each drug’s share over time, with the prior period one toggle away and exact values on hover.

Pick a brand, see where its patients went

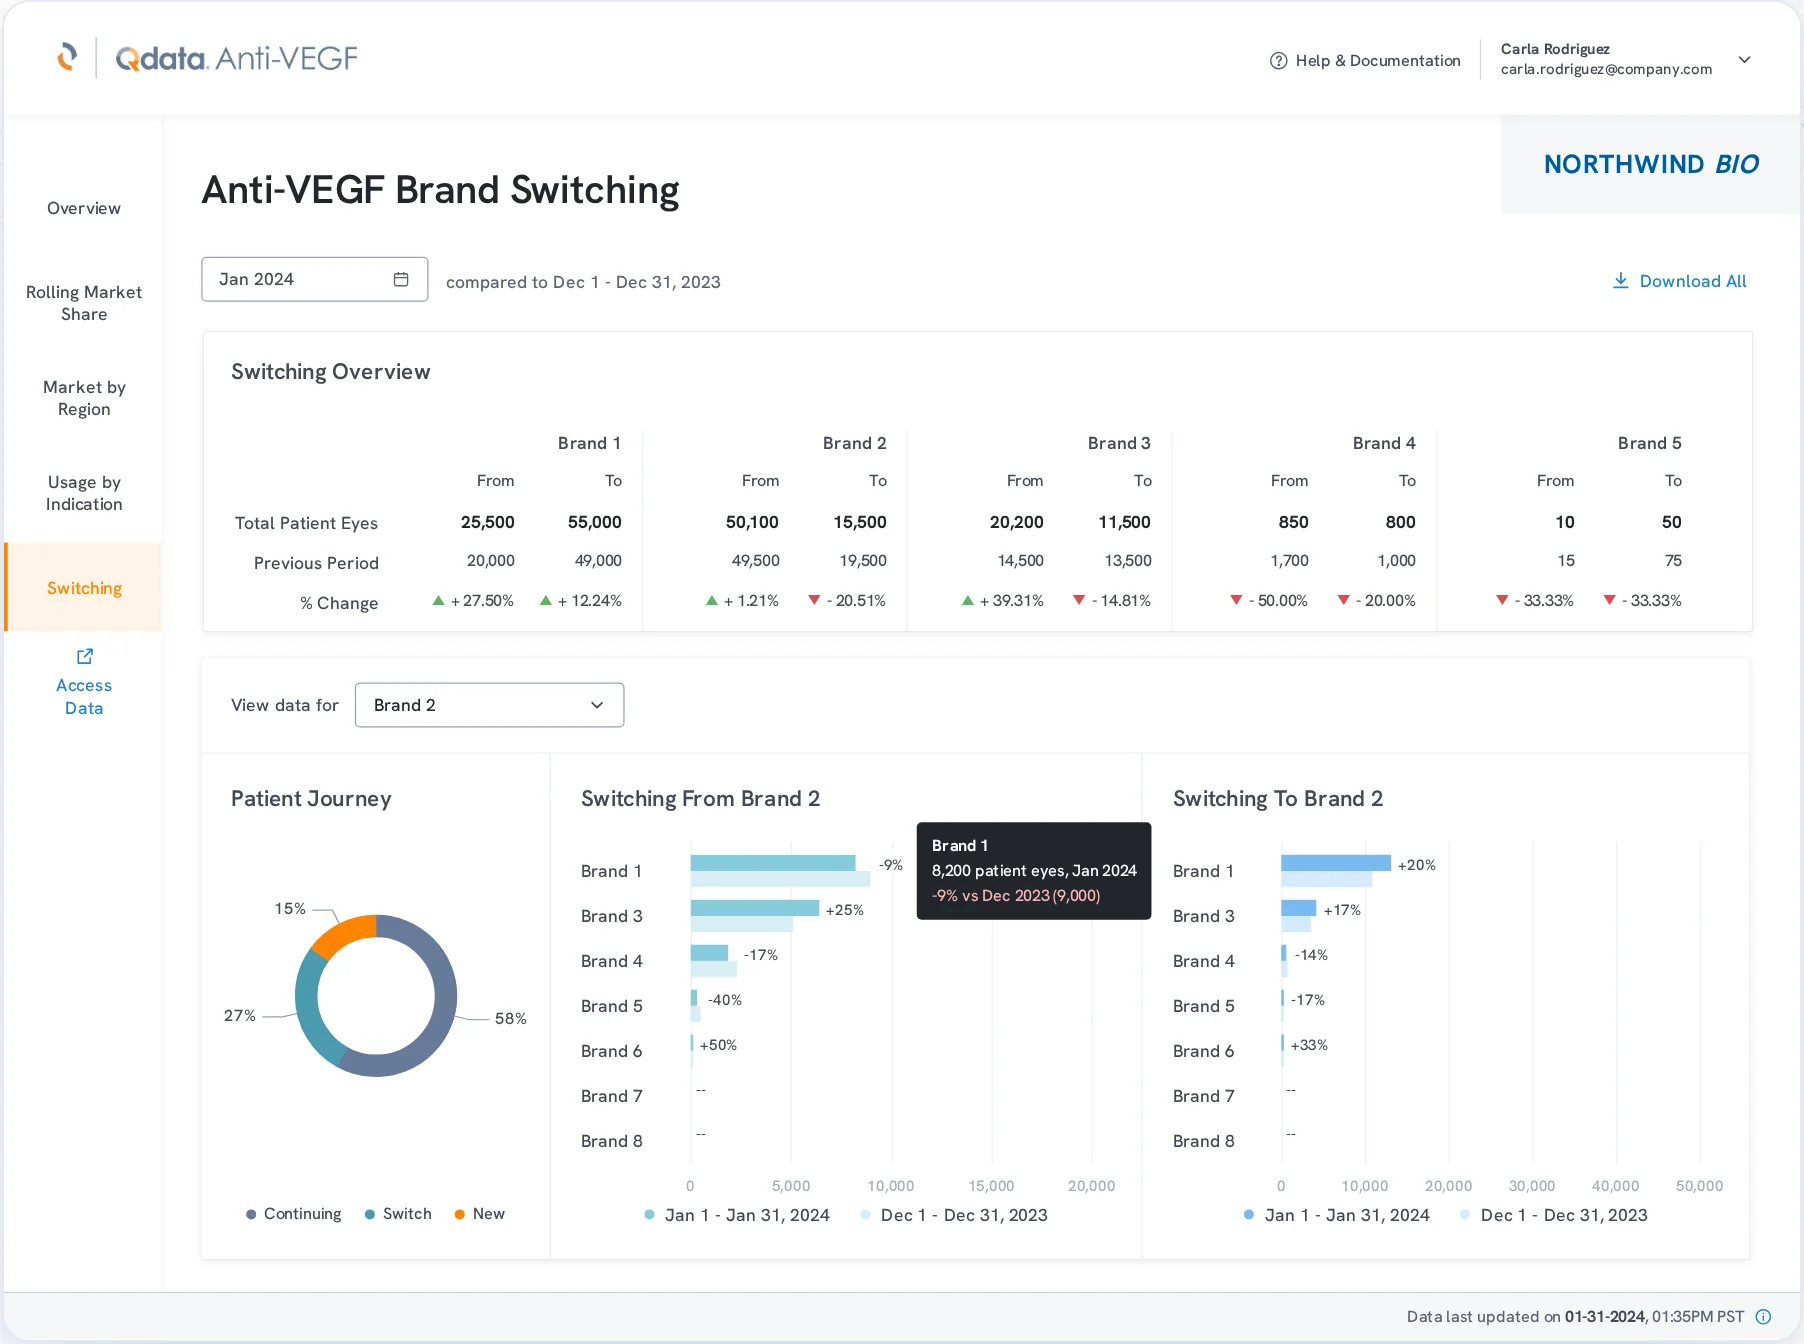
Switching answers the follow-up question in one view: who a brand is winning patients from, and who it is losing them to.

Help & Documentation
Carla Rodriguezcarla.rodriguez@company.com
Overview
Rolling Market
Share
Market by
Region
Usage by
Indication
Switching
Access
Data
NORTHWIND BIO

Anti-VEGF Brand Switching

Dec 2023
compared to Nov 1 - Nov 30, 2023
Download All
Oct 2023
Nov 2023
Dec 2023
Jan 2024
Data last updated on 01-31-2024, 01:35PM PST

Switching Overview

  Total Patient EyesPrevious Period% Change
Brand 1
FromTo
25,50055,000
20,00049,000
+ 27.50%+ 12.24%
Brand 2
FromTo
50,10015,500
49,50019,500
+ 1.21%- 20.51%
Brand 3
FromTo
20,20011,500
14,50013,500
+ 39.31%- 14.81%
Brand 4
FromTo
850800
1,7001,000
- 50.00%- 20.00%
Brand 5
FromTo
1050
1575
- 33.33%- 33.33%
View data for
Brand 1
Brand 1
Brand 2
Brand 3
Brand 4
Brand 5

Patient Journey

ContinuingSwitchNew

Switching From Brand 1

05,00010,00015,00020,000
Brand 2
Brand 3
Brand 4
Brand 5
Brand 6
Brand 7
Brand 8
Jan 1 - Jan 31, 2024Dec 1 - Dec 31, 2023

Switching To Brand 1

010,00020,00030,00040,00050,000
Brand 2
Brand 3
Brand 4
Brand 5
Brand 6
Brand 7
Brand 8
Jan 1 - Jan 31, 2024Dec 1 - Dec 31, 2023
Brand switching. Patients gained and lost by competitor, with the prior period beside every bar.

Five views planned, three shipped first

Working with a panel of subject matter experts, I ranked the five planned views by the questions brand teams ask first. My design for the top three went into build soon after: overview, rolling share and switching, shipped first to make the launch date. Beta then added filters by brand, indication, region, specialty and demographics.

$1M+per customer each year
2.7M+patients and 7,300+ clinicians in the data
1 modata lag, versus up to 3 for claims data

Verana’s first data-as-a-service product, shaped with pharma brand teams through alpha and beta.

Next case
Agentic Study Startup